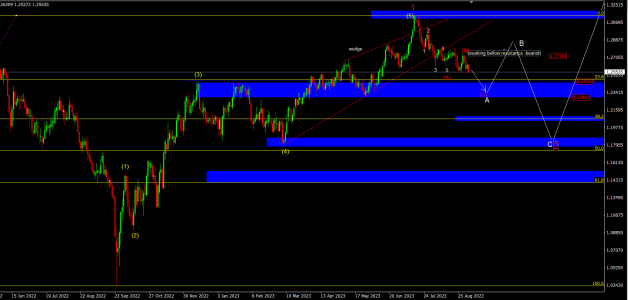
GBP/USD September 5th
On a daily chart clear 5 waves up (that represent impulsive Elliott wave 1), with the nicely drawn 4th flat wave and wedge pattern in the 5th wave, which is a clear sign that the bears are coming to the scene and beginning of a correction to the downside or corrective Elliott wave 2. Another confirmation is breaking below resistance 1.2719.
So, after the 5 Elliott waves have clearly finished, we now expect correction to the downside, which is already started. It can be flat, zig zag or more complex
The first support zone is, as it is drawn on the chart, area between swing low and swing high 1.2456 - 1.2289 That is our first target, where we can see move to the up, as a part of a downside correction ABC or Flat, and then to the downside there is one very strong area at the end of the 4th wave, around 1.1813, which is by the Elliot wave theory area that corrective second wave could tested.
Significant zone that the price can tested in a corrective second wave, before it resumes uptrend is between 50 –61.8% Fibonacci retracement. Bear in mind that this is a daily chart, and bigger picture, and that the first wave took almost one year to develop, so the second wave could be the same time length.
