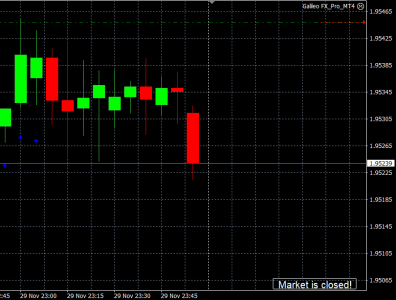
If I understand correctly, I think the red line might be your Stop Loss position. The green line is your entry position, and the red line is often the stop loss position. Clicking the red line and manually dragging it up and down allows you to quickly adjust your stop loss position. I may be wrong but that is what the red line on my charts means.