papercuts
New member
Bullish and bearish signals being the only thing we can adjust, leaves a lot to the imagination as far as what it is or is not doing. Is there any planes to write up something about the algorithm? Doesn't need specifics, just something so I have an idea of what's actually being considered.
Forex volume is apparently a little different conceptually than equities. Does GalileoFX consider volume in calculations?
Is it MTF or Higher timeframe aware?
Does it use popular calculations like CCI, RSI, MACD, DMI etc?
Does it use more modern averages like RSVAEMA or HMA?
I think I am ultimately looking for some confidence to trust it, and some clarity on what's being considered.
(FYI: It's just killing me there is no clarity on what's happening inside the code as a code myself.)
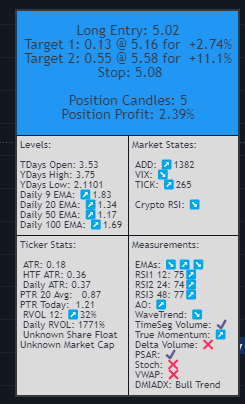
For example... I've created my own (nonpublic) tool, aka "Papercuts" for Tradingview and also inside Tradestation and it shows the calculations in a simple way, and its algo measures each and draws conclusions on all this data. It has an info panel that can be "simplified" or "full" . If your in a position it shows different info then when you are not and color changes make it very clear.
This really helps with confidence in trusting the tool as you can see nothing is out of wack or mis-considered. Mine also considers many other things not included in the readout, but for simplicity, it's where it currently sits.
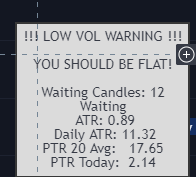
Here are a couple example screen shots of the info panel for example.
in a long position.... full panel, and "simplified view"


and when flat....


Just figured I'd share these as ideas to consider for future updates.
Forex volume is apparently a little different conceptually than equities. Does GalileoFX consider volume in calculations?
Is it MTF or Higher timeframe aware?
Does it use popular calculations like CCI, RSI, MACD, DMI etc?
Does it use more modern averages like RSVAEMA or HMA?
I think I am ultimately looking for some confidence to trust it, and some clarity on what's being considered.
(FYI: It's just killing me there is no clarity on what's happening inside the code as a code myself.)
For example... I've created my own (nonpublic) tool, aka "Papercuts" for Tradingview and also inside Tradestation and it shows the calculations in a simple way, and its algo measures each and draws conclusions on all this data. It has an info panel that can be "simplified" or "full" . If your in a position it shows different info then when you are not and color changes make it very clear.
This really helps with confidence in trusting the tool as you can see nothing is out of wack or mis-considered. Mine also considers many other things not included in the readout, but for simplicity, it's where it currently sits.
Here are a couple example screen shots of the info panel for example.
in a long position.... full panel, and "simplified view"


and when flat....


Just figured I'd share these as ideas to consider for future updates.
