I’ve experienced the same. I tell them all they need is a reverse switch so buys become sells and vise versa and we’d be making a lot of money. But nothing.Hello,
I understand the printscreens and the values of BULL and BEAR, but in reality, it is the opposite of what instructions say it is
GALFX instructions - The lowest the BULL value is, the biggest is the chance to open a BUY position
GALFX instructions - The lowest the BEAR value is, the biggest is the chance to open a SELL position
This is exactly the opposite of what you are showing, so...
How can you demonstrate the exact opposite of what instructions say? I am not sure what to do..follow what you say or follow the instructions
Is there another view for this?
Thanks
Daniel
You are using an out of date browser. It may not display this or other websites correctly.
You should upgrade or use an alternative browser.
You should upgrade or use an alternative browser.
Profitable Settings and Backtesting?
- Thread starter papercuts
- Start date
Hello papercuts,I bought pro, got it all setup and running, and imported setting and was doing tests... it looks like no setting in any configuration are profitable. I am wondering how this is possible. I am under the assumption this can be hands free for non-aggressive folks but all of my settings tester results just show consistent draw down with any options i throw at it. I feel like I am missing something. I've run through al the docs and forums here, and even with pro settings and settings posted by others it doesn't show profitability.
What am i missing? Here's what i did.
- Load Galileofx
- load preferred chart EURUSD
- load premium settings
- adjust lots to fit my account size
- Set chart time (would like to use m15 or m30)
- Activate Gfx
- Use Expert advisor tester (MT4) with a given timeframe (looking from jan01 2023 till now)
- Review report.
Is this process correct? Beccause every possible config is causing a slow bleed. I must be missing something.
I recently purchased the Pro version as well. I wasn't very satisfied with the preconfigured settings provided by the company and then I found a great video on Youtube by Ruben Santos showing complete calibration for Galileo FX. Great step by step instruction on optimizing Galileo FX. I am testing using a demo account right now. Hope this helps.
Daniel Portugal
Member
Well, i guess that it has to be the hard way 
I will open a forex pair with a set of BULL2 BEAR 7 and then i will open again the same pair with BULL7 and BEAR 2.
the end result will dictate if
- MORE BULL will open more BUY trades
or
- LESS BULL will open more BUY trades
Honnestly ..i havent got to a conclusion about this. i did made some tests with this and if you put for example 5/4 is inconclusive but if you put something like 7/2 i think it goes the opposite of instructions
Daniel Portugal
Member
So, simulated EURCHF from 27/09 to 12/10
It is clearly a downs trend
tested the best configurations possible and the conclusion was
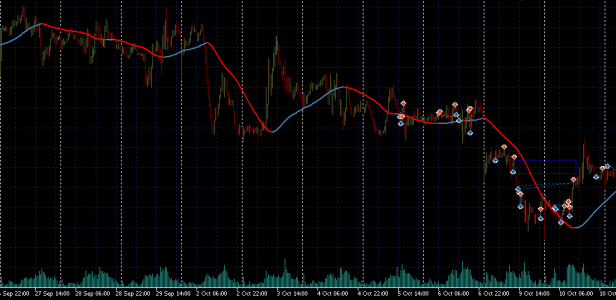
For this graph we can see that is not 100% down trend but in average it is mostly down trend
Conclusion was for the same amount of lots without SL or TP:
Best Consecutive BULL Signals were 0,1,2,4
Best consecutive BEAR Signals were 5,7,4,11
Best of the best - BULL=0 and BEAR= 5
This goes against the logic of the GALFX manual.
So, If you want good Profil the logic is reversed.
So, if the TREND is BEAR, the consecutive BEAR signals should be bigger that the BULL signals
I will send one graph with more consistency in terms of trend, but this should be easy to evaluate
It is clearly a downs trend
tested the best configurations possible and the conclusion was

For this graph we can see that is not 100% down trend but in average it is mostly down trend
Conclusion was for the same amount of lots without SL or TP:
Best Consecutive BULL Signals were 0,1,2,4
Best consecutive BEAR Signals were 5,7,4,11
Best of the best - BULL=0 and BEAR= 5
This goes against the logic of the GALFX manual.
So, If you want good Profil the logic is reversed.
So, if the TREND is BEAR, the consecutive BEAR signals should be bigger that the BULL signals
I will send one graph with more consistency in terms of trend, but this should be easy to evaluate
Daniel Portugal
Member
Please, do not follow blindly these results, those were just my conclusions.. Please test them well and in a demo account
Then the instruction is wrong because when you set Bull Signal to 6 ...he waits 6 candles in a row for a sell position and vice versa when you set bear to 6 then he will buy!!!!Hello,
I understand the printscreens and the values of BULL and BEAR, but in reality, it is the opposite of what instructions say it is
GALFX instructions - The lowest the BULL value is, the biggest is the chance to open a BUY position
GALFX instructions - The lowest the BEAR value is, the biggest is the chance to open a SELL position
This is exactly the opposite of what you are showing, so...
How can you demonstrate the exact opposite of what instructions say? I am not sure what to do..follow what you say or follow the instructions
Is there another view for this?
Thanks
Daniel
Daniel Portugal
Member
Well, im not sureif that is the true..i just looked at the results - This is a downtrend graph
If you place zero in bull and in bear...you can see that it opens indeed the biggest amount of trades! so....a small value implies more open trades...
But...look at the profit....if you fix the bull in zero and the bear changes for the same parameters...it is a significant difference
and..the most important aspect that i see is that the number of trades between bear 3 to 7 is almost the same...
In a broad look...the more you increase the BEAR number...the higher the profit you have
In comparison, being BULL zero, it should buy like crazy and it doesn't do that
well..food for thought
not trying to explain how the GALFX works...just looking at numbers
| Profit | Trades | stopLoss | takeProfit | iTrailingStart | iTrailingStep | iBullishX | iBearishX |
-1053,77 | 506 | 0 | 0 | 0 | 0 | 0 | 0 |
2493,45 | 390 | 0 | 0 | 0 | 0 | 0 | 1 |
4489,10 | 321 | 0 | 0 | 0 | 0 | 0 | 2 |
5502,88 | 287 | 0 | 0 | 0 | 0 | 0 | 3 |
5951,52 | 269 | 0 | 0 | 0 | 0 | 0 | 4 |
6147,43 | 259 | 0 | 0 | 0 | 0 | 0 | 5 |
6245,90 | 254 | 0 | 0 | 0 | 0 | 0 | 6 |
6267,20 | 253 | 0 | 0 | 0 | 0 | 0 | 7 |
If you place zero in bull and in bear...you can see that it opens indeed the biggest amount of trades! so....a small value implies more open trades...
But...look at the profit....if you fix the bull in zero and the bear changes for the same parameters...it is a significant difference
and..the most important aspect that i see is that the number of trades between bear 3 to 7 is almost the same...
In a broad look...the more you increase the BEAR number...the higher the profit you have
In comparison, being BULL zero, it should buy like crazy and it doesn't do that
well..food for thought
not trying to explain how the GALFX works...just looking at numbers
Daniel Portugal
Member
Daniel Portugal
Member
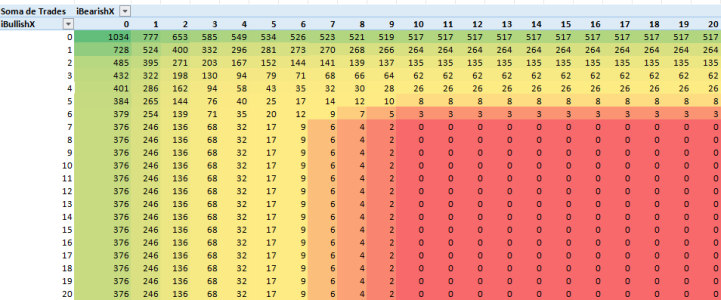
About the number of trades
BULL/BEAR above 10 in most cases dont do a thing
BULL/BEAR values between 6 and 10 dont affect much the number of trades
So, configuring these values should be done between 0 and 6
About the profit of trades (example in a downtrend <- This is important)
- the more the BULL value increases the worse is the result
- the more the BEAR value increases the best is the result
Having these in mind, and for this case of downtrend, the best configuration would be
Consecutive BULLS = 0
Consecutive BEARS = 6
The majority of times where BEAR number is bigger than BULL number IN DOWNTREND, the resut is positive in profit

You can say that if you want to manage risc, make the gap smaller between BULL and BEAR number and make the numbers bigger so that you earn less but trade less
Example for downtrend:
BULL = 0 BEAR = 1 - > 777 trades and 5643 profit
BULL = 0 BEAR = 6 - > 526 trades and 12580 profit
So, in sum
UP TREND - > BULL bigger than BEAR
DOWN TREND - > BULL smaller than BEAR
The bigger the gap, the most profit you get (if you guess the trend right, so increase or decrease with the certain or uncertain of the trend)
About number of trades, in general you can say that
BULL + BEAR bigger than 12 is not expected to open trades
BULL + BEAR = 0 will open the biggest amount of trades
For each 2, will decrease the number of trades in 50% aprox.
BULL + BEAR = 0 -> 1043 trades
BULL + BEAR = 2 -> 524 trades
BULL + BEAR = 4 -> 271 trades
...
For all these numbers .. every value was 0 on all parameters except lot 0.05 (could be another value that the result in theory is the same)
EURCHF from 27-09-27 to 12-10-12 in M30
Hope it helps everyone, just dont use this information blindly...test it first...try in demo...and if you feel something is wrong...share it
Thanks
Daniel
BULL/BEAR above 10 in most cases dont do a thing
BULL/BEAR values between 6 and 10 dont affect much the number of trades
So, configuring these values should be done between 0 and 6
About the profit of trades (example in a downtrend <- This is important)
- the more the BULL value increases the worse is the result
- the more the BEAR value increases the best is the result
Having these in mind, and for this case of downtrend, the best configuration would be
Consecutive BULLS = 0
Consecutive BEARS = 6
The majority of times where BEAR number is bigger than BULL number IN DOWNTREND, the resut is positive in profit

You can say that if you want to manage risc, make the gap smaller between BULL and BEAR number and make the numbers bigger so that you earn less but trade less
Example for downtrend:
BULL = 0 BEAR = 1 - > 777 trades and 5643 profit
BULL = 0 BEAR = 6 - > 526 trades and 12580 profit
So, in sum
UP TREND - > BULL bigger than BEAR
DOWN TREND - > BULL smaller than BEAR
The bigger the gap, the most profit you get (if you guess the trend right, so increase or decrease with the certain or uncertain of the trend)
About number of trades, in general you can say that
BULL + BEAR bigger than 12 is not expected to open trades
BULL + BEAR = 0 will open the biggest amount of trades
For each 2, will decrease the number of trades in 50% aprox.
BULL + BEAR = 0 -> 1043 trades
BULL + BEAR = 2 -> 524 trades
BULL + BEAR = 4 -> 271 trades
...
For all these numbers .. every value was 0 on all parameters except lot 0.05 (could be another value that the result in theory is the same)
EURCHF from 27-09-27 to 12-10-12 in M30
Hope it helps everyone, just dont use this information blindly...test it first...try in demo...and if you feel something is wrong...share it
Thanks
Daniel
Last edited:
With the amount we paid for the pro version, i expected the presets provided to be the calibrated numbers.Hello papercuts,
I recently purchased the Pro version as well. I wasn't very satisfied with the preconfigured settings provided by the company and then I found a great video on Youtube by Ruben Santos showing complete calibration for Galileo FX. Great step by step instruction on optimizing Galileo FX. I am testing using a demo account right now. Hope this helps.
thank you, kindly keep posting. good luckSo, simulated EURCHF from 27/09 to 12/10
It is clearly a downs trend
tested the best configurations possible and the conclusion was
View attachment 1709
For this graph we can see that is not 100% down trend but in average it is mostly down trend
Conclusion was for the same amount of lots without SL or TP:
Best Consecutive BULL Signals were 0,1,2,4
Best consecutive BEAR Signals were 5,7,4,11
Best of the best - BULL=0 and BEAR= 5
This goes against the logic of the GALFX manual.
So, If you want good Profil the logic is reversed.
So, if the TREND is BEAR, the consecutive BEAR signals should be bigger that the BULL signals
I will send one graph with more consistency in terms of trend, but this should be easy to evaluate
Daniel Portugal
Member
Can someone make one analysis for uptrend? I could gladly do it, but i would like someone different than me to do it...
The reason is that 2 independent persons can get the same conclusion or totally different conclusion, but in the end, the result would be far more reliable and everyone could benefit from it
Thanks
Daniel
The reason is that 2 independent persons can get the same conclusion or totally different conclusion, but in the end, the result would be far more reliable and everyone could benefit from it
Thanks
Daniel
sir could you make also on a 2 different broker. i observed the octa broker that the bot has a good trade and response.Can someone make one analysis for uptrend? I could gladly do it, but i would like someone different than me to do it...
The reason is that 2 independent persons can get the same conclusion or totally different conclusion, but in the end, the result would be far more reliable and everyone could benefit from it
Thanks
Daniel
Daniel Portugal
Member
Lister, i would but there are 2 problems with thatsir could you make also on a 2 different broker. i observed the octa broker that the bot has a good trade and response.
- First - does not belong to this thread (Profitable settings)
- Second - the data that i presented was about bull/bear numbers and i have used the M30 time interval, so i think i can say that the only parameters that could affect the broker would be the M30
If you were using M1....then the impact of the broker would higher or..on the opposite side, if your positions were for a week or even more, then the broker is very importart.
So, how did you chose your broker?
- My evaluations for brokers were the following
- Can handle deposit and withdrawals without problems and commissions
- Can allow very low swaps
- Can hedge
- Can have decent mobile app (important if you need to follow your trades)
- Can have MT4/5 interface (in this case necessary to use GALFX)
- For some cases micro accounts or cent accounts
- Should have the minimum spread possible or no spread at all depending on type of account you use
- Also the time to open a position (fast servers) - If you are very serious about trading in dangerous days (news)
So, we can talk about that ..in another topic if you wish...
PS: im not an expert in brokers or in GALFX but i do like numbers and to study them
Vinitrader
Member
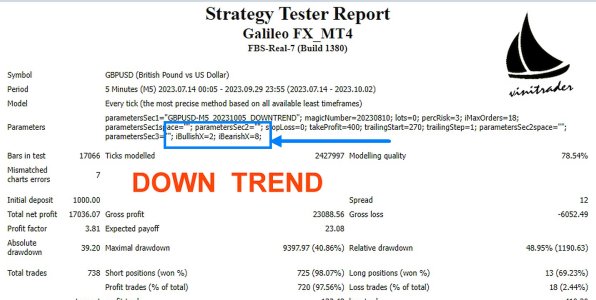
If you look closely, you came to the same conclusion "as the manual indicates". For a BEARISH TREND the GREATER the value in Consecutive Bearish SignalsSo, simulated EURCHF from 27/09 to 12/10
It is clearly a downs trend
tested the best configurations possible and the conclusion was
View attachment 1709
For this graph we can see that is not 100% down trend but in average it is mostly down trend
Conclusion was for the same amount of lots without SL or TP:
Best Consecutive BULL Signals were 0,1,2,4
Best consecutive BEAR Signals were 5,7,4,11
Best of the best - BULL=0 and BEAR= 5
This goes against the logic of the GALFX manual.
So, If you want good Profil the logic is reversed.
So, if the TREND is BEAR, the consecutive BEAR signals should be bigger that the BULL signals
I will send one graph with more consistency in terms of trend, but this should be easy to evaluate
Attachments
Alex Trader
New member
Which pair you find the best for trading?sometimes works very good but it depends on the pair selected.
Vinitrader
Member
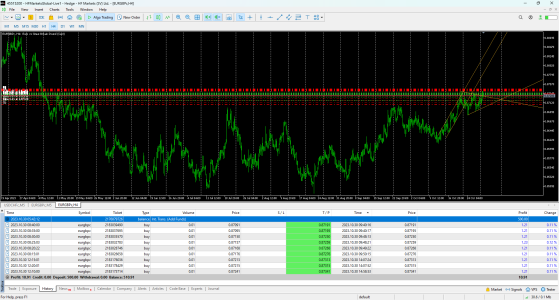
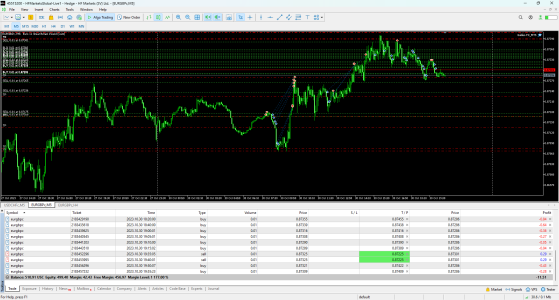
AUDUSD, EURGBP work for me. I started a fresh cent account with $500 cents ($5) which you can escalate later. The problem is that for cent accounts spreads are too high but I tried to optimize for these. Let's see how it goes !!!Which pair you find the best for trading?
Attachments
THANK YOU FOR ALL OF THIS, EXPECTING MORE FROM YOUAbout the number of trades
BULL/BEAR above 10 in most cases dont do a thing
BULL/BEAR values between 6 and 10 dont affect much the number of trades
So, configuring these values should be done between 0 and 6
About the profit of trades (example in a downtrend <- This is important)
- the more the BULL value increases the worse is the result
- the more the BEAR value increases the best is the result
Having these in mind, and for this case of downtrend, the best configuration would be
Consecutive BULLS = 0
Consecutive BEARS = 6
The majority of times where BEAR number is bigger than BULL number IN DOWNTREND, the resut is positive in profit
View attachment 1713
You can say that if you want to manage risc, make the gap smaller between BULL and BEAR number and make the numbers bigger so that you earn less but trade less
Example for downtrend:
BULL = 0 BEAR = 1 - > 777 trades and 5643 profit
BULL = 0 BEAR = 6 - > 526 trades and 12580 profit
So, in sum
UP TREND - > BULL bigger than BEAR
DOWN TREND - > BULL smaller than BEAR
The bigger the gap, the most profit you get (if you guess the trend right, so increase or decrease with the certain or uncertain of the trend)
About number of trades, in general you can say that
BULL + BEAR bigger than 12 is not expected to open trades
BULL + BEAR = 0 will open the biggest amount of trades
For each 2, will decrease the number of trades in 50% aprox.
BULL + BEAR = 0 -> 1043 trades
BULL + BEAR = 2 -> 524 trades
BULL + BEAR = 4 -> 271 trades
...
For all these numbers .. every value was 0 on all parameters except lot 0.05 (could be another value that the result in theory is the same)
EURCHF from 27-09-27 to 12-10-12 in M30
Hope it helps everyone, just dont use this information blindly...test it first...try in demo...and if you feel something is wrong...share it
Thanks
Daniel
Similar threads
- Replies
- 5
- Views
- 763
J
- Replies
- 2
- Views
- 741
