Yes, very confusing.
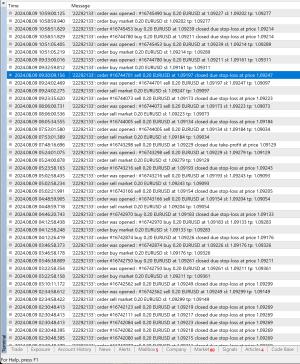
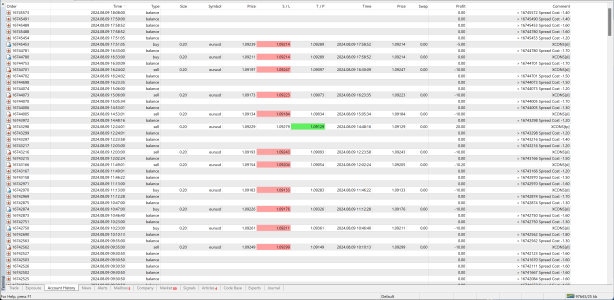
If you look closely on the chart, there is a microscopic blue and red mark directly above and below the microscopic arrow. Those are the SL & TP for that particular order. Unfortunately you can't change the size of those marks. But yes, it is disturbing that on the trade tab they are all the same representing the last SL &TP generated. the journal will have the SL & TP values, and from there, it seems the orders are close at the correct price.
You can change colors of the bars, and you can add an ask bar, but since the spread is between bid and ask, not sure why they can't show bid as well. There should be another column showing the P&L including the spread cost. After all, it is a fundamental part of your profit. I am not sure how anybody makes money here. If you trim you lot size you reduce your profit. There is a mix of pip and dollars, the time between the journal and the trade times are different time zones, WTH? Maybe MT5 is better? I doubt it. I paid a lot of money but the app seems lacking.
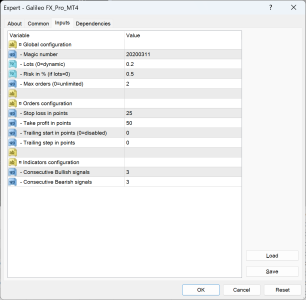
It also bothers me that I can't see an indicator showing the number of, and where the bull signals are happening. It helps to see that so you can adjust your strategy. I would love to see the candlesticks numbered as the signals accumulate. When I first started, I was confused as to what a bullish signal does. I assumed it buys, but no, it sells, assuming it is looking for a turnaround. The logic is OK, but some of the descriptions seem conflicting. It should be marked next to bullish, "issue sell order".
Bob